
 Intensity (ten-minute mean)
韋帕 Wipha
- Peak wind
- 111km/h
- Lowest pressure
- 975hPa
- Closest approach
- about 50km south-east
- Hong Kong Observatory
- Hurricane Signal No. 10


- Mean peak, eight stations
- 75.6km/h
- Waglan Island
- not recorded
Ten-minute mean sustained winds measured by the Observatory, not computed here. Stations differ greatly: Waglan Island faces open sea while urban stations sit among buildings, so the same storm can read twice as high at one as at the other.
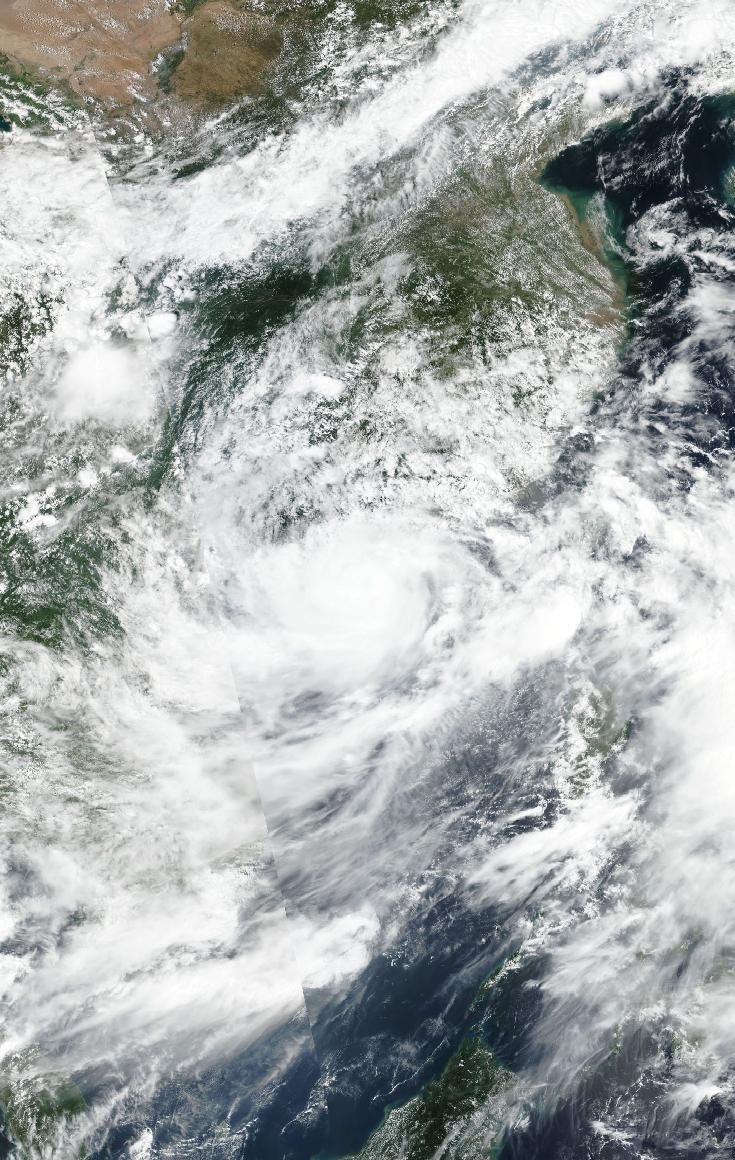
A broad circulation that passed roughly 50 km south of Hong Kong. The No. 10 signal stayed up for close to seven hours.
Satellite image 20 Jul 2025 · NASA Worldview · VIIRS
Track timeline
 Track timeline
- —998 hPa
- 65 km/h994 hPa
- 74 km/h985 hPa
- 93 km/h980 hPa
- 111 km/h975 hPa
- 83 km/h985 hPa
Full track
 Full track
A best track is after-the-fact reanalysis, not what was forecast at the time. All times UTC+8.
| Time | Position | Pressure | Wind |
|---|---|---|---|
| 17 Jul 14:00 | 15.4°N 127.3°E | 998 hPa | — |
| 17 Jul 20:00 | 16.1°N 126.2°E | 998 hPa | — |
| 18 Jul 02:00 | 16.7°N 125.1°E | 996 hPa | — |
| 18 Jul 08:00 | 17.4°N 124.1°E | 994 hPa | 65 km/h |
| 18 Jul 14:00 | 18.6°N 123.0°E | 990 hPa | 65 km/h |
| 18 Jul 20:00 | 19.6°N 122.3°E | 990 hPa | 65 km/h |
| 19 Jul 02:00 | 19.9°N 120.9°E | 985 hPa | 74 km/h |
| 19 Jul 08:00 | 20.0°N 120.0°E | 985 hPa | 83 km/h |
| 19 Jul 14:00 | 20.6°N 119.0°E | 980 hPa | 93 km/h |
| 19 Jul 20:00 | 21.2°N 117.7°E | 980 hPa | 93 km/h |
| 20 Jul 02:00 | 21.5°N 116.0°E | 980 hPa | 93 km/h |
| 20 Jul 08:00 | 21.6°N 114.7°E | 980 hPa | 102 km/h |
| 20 Jul 14:00 | 21.9°N 113.3°E | 975 hPa | 111 km/h |
| 20 Jul 20:00 | 21.8°N 112.2°E | 980 hPa | 102 km/h |
| 21 Jul 02:00 | 21.8°N 110.7°E | 980 hPa | 93 km/h |
| 21 Jul 08:00 | 21.4°N 109.8°E | 985 hPa | 83 km/h |
| 21 Jul 14:00 | 21.2°N 109.3°E | 985 hPa | 83 km/h |
| 21 Jul 20:00 | 20.9°N 108.2°E | 980 hPa | 93 km/h |
Further reading
- What an ensemble forecast is, and what it is not
A spray of tracks is a statement about uncertainty, not a menu of outcomes.
- Hong Kong's typhoon signals, explained
What each of the five levels means in wind speed, and why the No. 8 comes in four directions.
- Why a storm to the south brings easterly winds
Cyclones spin anticlockwise north of the equator, so the wind where you stand depends on which side of the storm you are on.