
 Intensity (ten-minute mean)
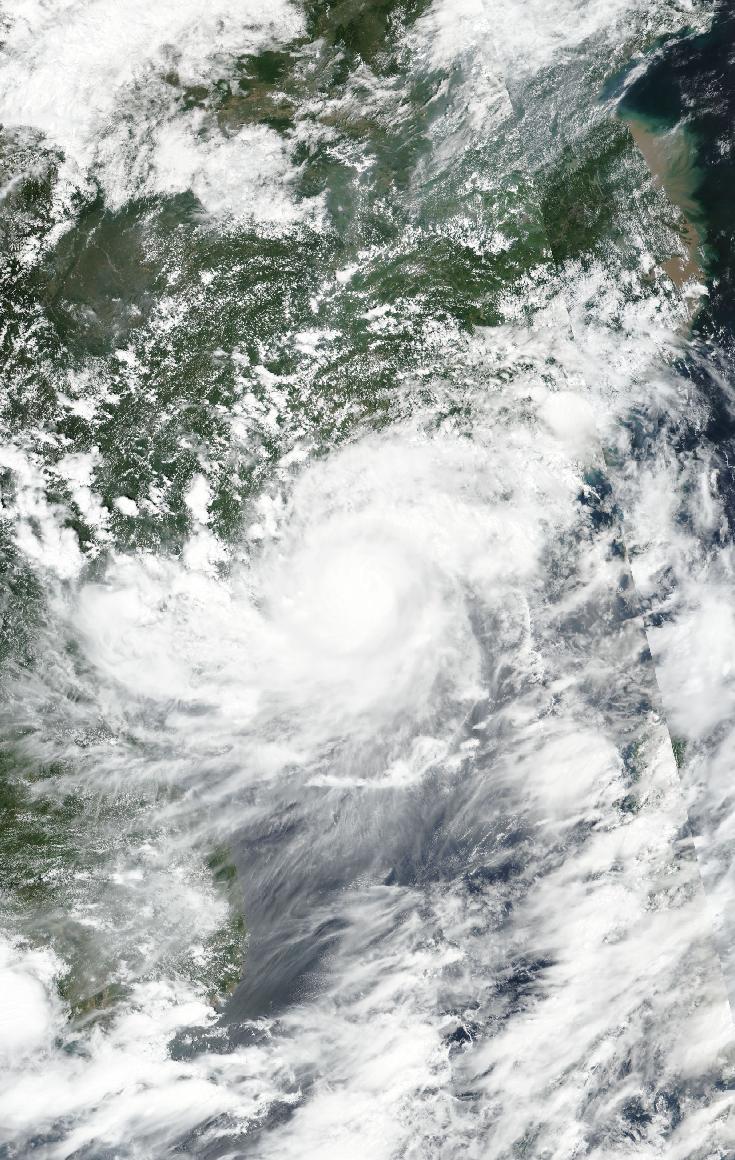
天鴿 Hato
- Peak wind
- 139km/h
- Lowest pressure
- 965hPa
- Closest approach
- about 60km south
- Hong Kong Observatory
- Hurricane Signal No. 10


- Mean peak, eight stations
- 74.2km/h
- Waglan Island
- not recorded
Ten-minute mean sustained winds measured by the Observatory, not computed here. Stations differ greatly: Waglan Island faces open sea while urban stations sit among buildings, so the same storm can read twice as high at one as at the other.
Intensified quickly over the South China Sea and struck the western side of the Pearl River Estuary head-on. Its storm surge set records.
Satellite image 23 Aug 2017 · NASA Worldview · VIIRS
Track timeline
 Track timeline
- 65 km/h998 hPa
- 65 km/h994 hPa
- 83 km/h985 hPa
- 120 km/h970 hPa
- 93 km/h985 hPa
- 65 km/h996 hPa
Full track
 Full track
A best track is after-the-fact reanalysis, not what was forecast at the time. All times UTC+8.
| Time | Position | Pressure | Wind |
|---|---|---|---|
| 20 Aug 20:00 | 19.7°N 126.9°E | 998 hPa | 65 km/h |
| 21 Aug 02:00 | 19.9°N 126.2°E | 996 hPa | 65 km/h |
| 21 Aug 08:00 | 20.2°N 125.4°E | 994 hPa | 65 km/h |
| 21 Aug 14:00 | 20.3°N 124.3°E | 994 hPa | 65 km/h |
| 21 Aug 20:00 | 20.6°N 123.2°E | 990 hPa | 74 km/h |
| 22 Aug 02:00 | 20.5°N 121.5°E | 990 hPa | 74 km/h |
| 22 Aug 08:00 | 20.5°N 119.8°E | 985 hPa | 83 km/h |
| 22 Aug 14:00 | 20.5°N 118.8°E | 975 hPa | 111 km/h |
| 22 Aug 20:00 | 20.6°N 117.3°E | 975 hPa | 111 km/h |
| 23 Aug 02:00 | 21.1°N 116.0°E | 970 hPa | 120 km/h |
| 23 Aug 08:00 | 21.6°N 114.4°E | 965 hPa | 139 km/h |
| 23 Aug 14:00 | 22.3°N 112.8°E | 965 hPa | 139 km/h |
| 23 Aug 20:00 | 22.7°N 111.0°E | 985 hPa | 93 km/h |
| 24 Aug 02:00 | 23.5°N 109.1°E | 994 hPa | 74 km/h |
| 24 Aug 08:00 | 23.9°N 107.5°E | 996 hPa | 65 km/h |
| 24 Aug 14:00 | 23.9°N 106.1°E | 996 hPa | 65 km/h |
| 24 Aug 20:00 | 23.8°N 104.5°E | 998 hPa | — |
Further reading
- What an ensemble forecast is, and what it is not
A spray of tracks is a statement about uncertainty, not a menu of outcomes.
- Hong Kong's typhoon signals, explained
What each of the five levels means in wind speed, and why the No. 8 comes in four directions.
- Why a storm to the south brings easterly winds
Cyclones spin anticlockwise north of the equator, so the wind where you stand depends on which side of the storm you are on.