

ABOUT AETHOPIA
See the weather. Know what's next.
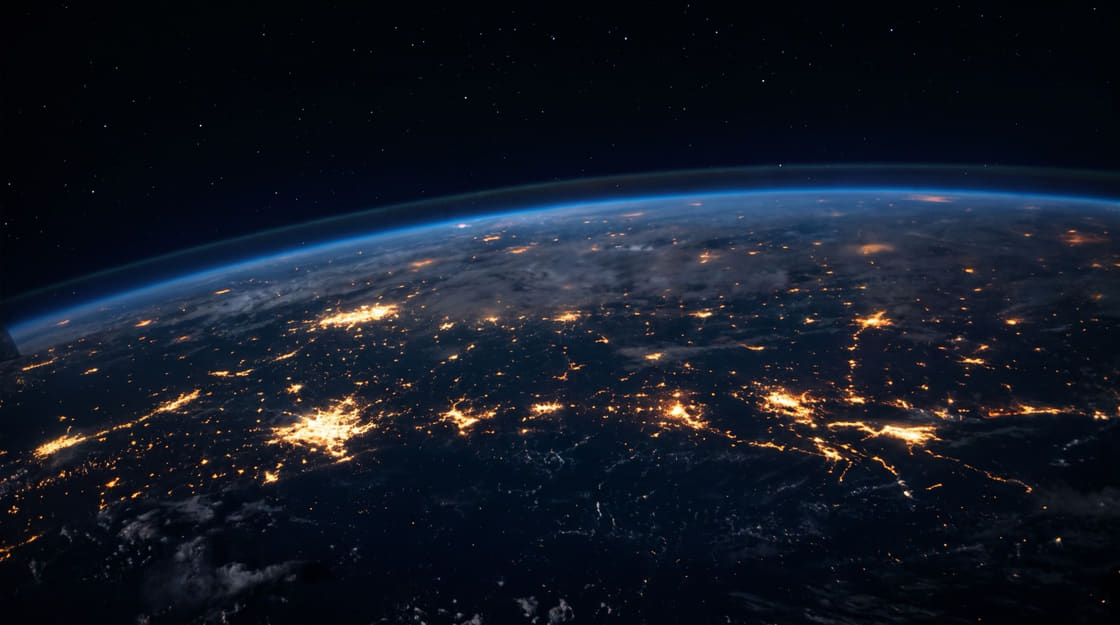
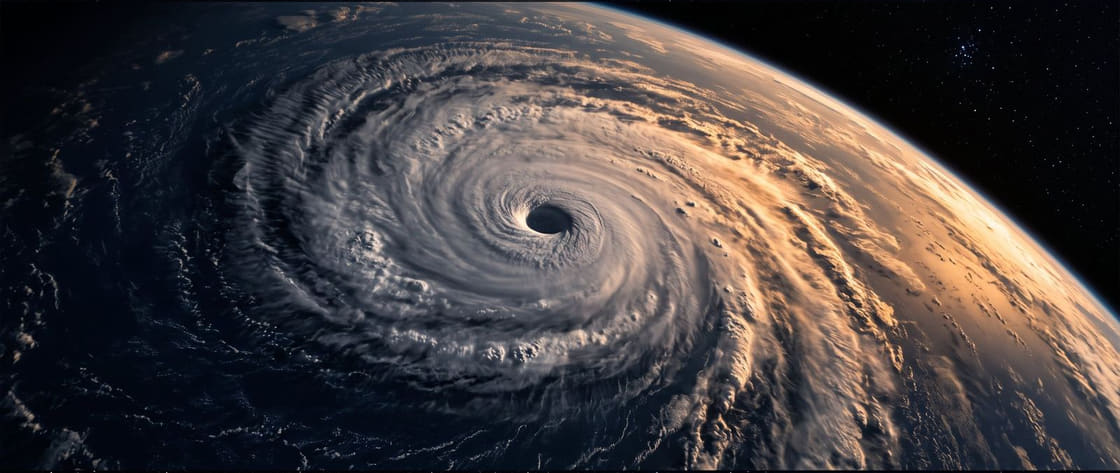
Aethopia puts official cyclone bulletins, global wind data and a physical model on one turnable globe: where a storm is, where it is headed, how strong the wind around it is.
The agencies publish the numbers every day. What was missing was never the numbers — it was somewhere to watch them move.
What this site is for
Figures issued by an agency appear exactly as issued, unadjusted. What no agency publishes — the shape of the wind field, how far the gales reach, how a past storm actually moved — is filled in here with a physical model, and each of those is marked as computed.
Global wind field
Wind at ten metres, drawn as particles, coloured by speed.
Official forecast tracks
Live cyclone position, timing and intensity, quoted from agency bulletins with the issue time.
Wind footprint
Fresh, gale, storm and hurricane bands drawn along the forecast track.
Replay past storms
Mangkhut, Hato and other cases replay from the start, showing how wind built across the city.
How it was built
The globe, the particles, the physics engine, the data plumbing and every line of copy are written by Aethopia. The wind field is not a stock image: it is computed cell by cell from global model data. Figures issued by agencies around the world are drawn together by Aethopia's own physical model.

Five lines this site holds
Written down so that whoever wants to relax one later — the author included — can see why it was drawn in the first place.
Every figure has a source
Each number can be traced to the agency and the bulletin it came from. Units are labelled where they are converted, and the values themselves are never adjusted.
What is computed says so
Anything worked out here carries a mark. It is never quietly mixed in among the official figures.
Physics, not machine learning
The wind field comes from a parameterised physical formula. Which formula it is, and whose paper it came from, is named on the sources page — not a box you cannot see into.
The limits are written down too
Known biases, the parts never calibrated and the cases where it breaks are listed one by one on the sources page — including the ones that do this site no favours.
Everyday nudges, never the official call
Take an umbrella, drink more water, put on a jacket, keep off open ground — that much this site will say. Whether a warning signal goes up, whether schools close, whether a flight is changed, it will not. Those three belong to the official bulletin, and being wrong about them would cost you, not this site.


Numbers you can check
Only what can actually be counted. Each one is derived from the site's own data, not typed in.
- 4Official sourcesTracks, intensity, warnings, global wind
- 5Storms you can replayBest tracks, 2012–2025
- 10ExplainersFrom the basics to case studies
- 6Airports coveredObservations and forecast reports
Get the app
Today's weather, tropical cyclones and aviation, the same data on your phone and on the web; Home Screen and Lock Screen widgets refresh every half hour.
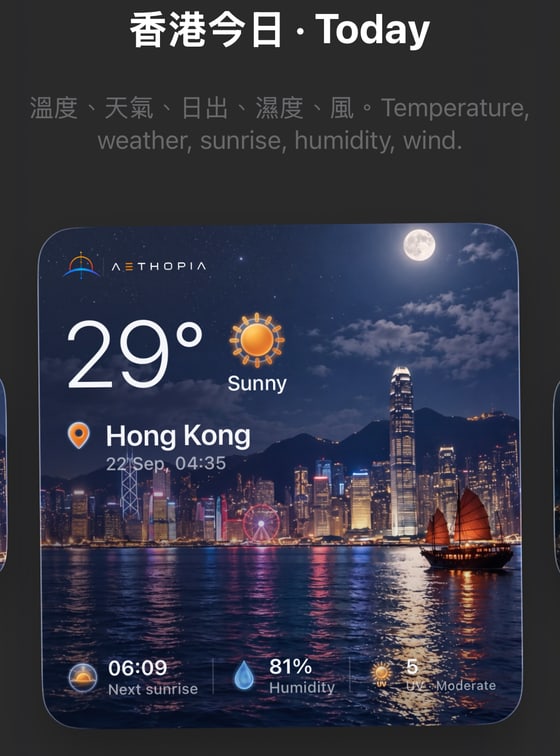
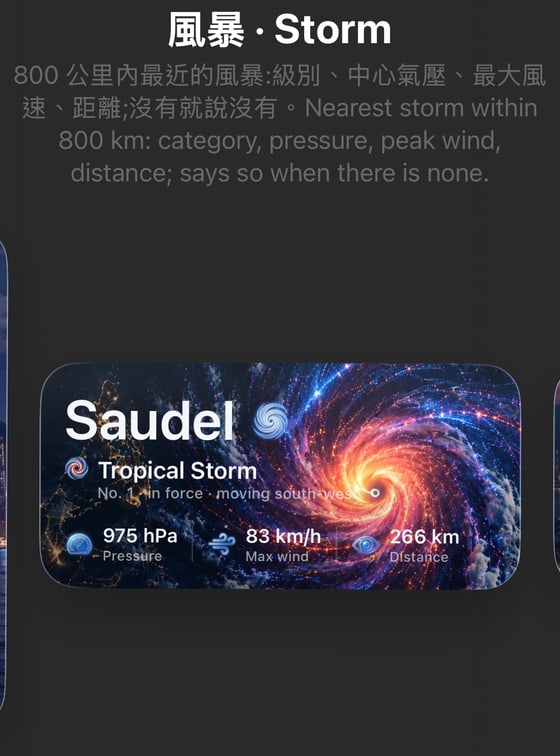
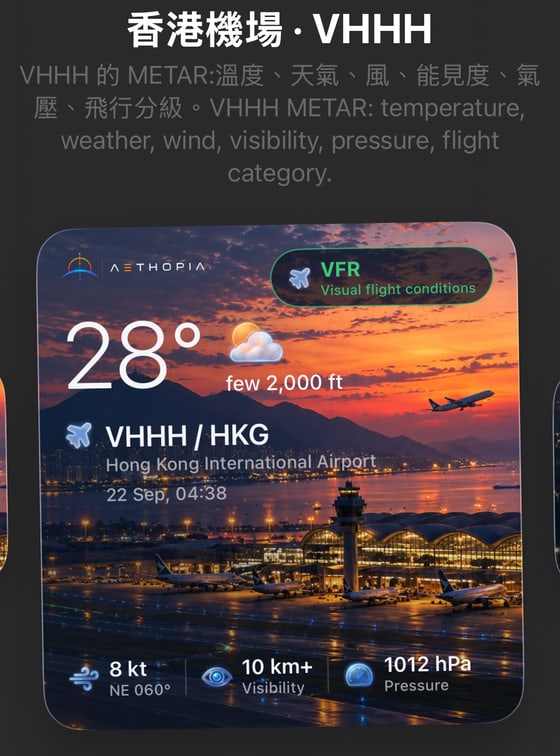
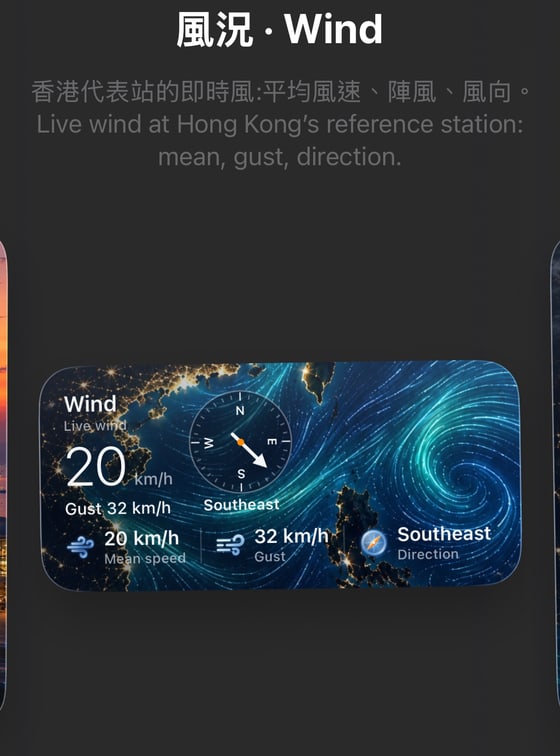
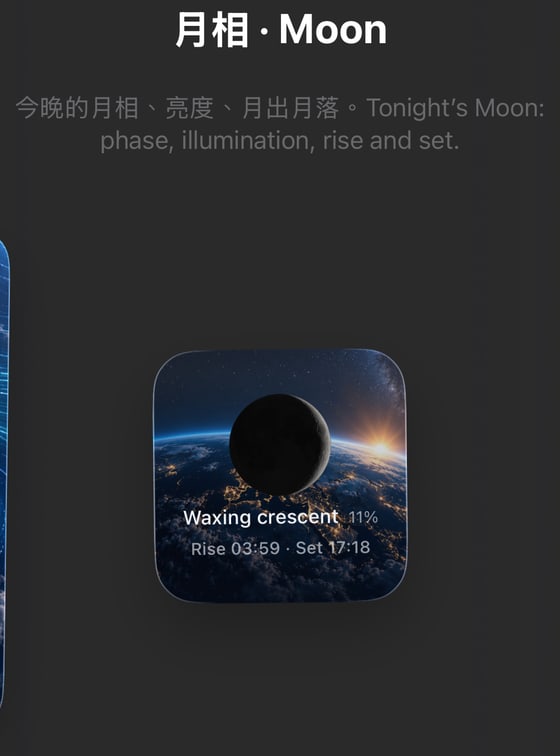
Home Screen and Lock Screen widgets, with a harbour photo that follows the time of day; data refreshes every half hour. More about the app →