

Knots, km/h and the Beaufort scale
Two agencies can quote the same storm 20 per cent apart. They are not disagreeing; they are measuring different things.
Unit conversion is the easy part. The hard part is the averaging period. US agencies quote a one-minute mean; the Japan Meteorological Agency and the Hong Kong Observatory quote a ten-minute mean. For the same storm the one-minute figure runs roughly 14 per cent higher; the WMO puts the factor at 0.88.
Read the averaging period alongside the number, or two agencies will look like they are disagreeing when they are not. A storm the JMA puts at 100 knots over ten minutes may appear as 114 knots one-minute from a US centre. Both are correct.
| Hong Kong signal | Sustained km/h | Knots | Beaufort |
|---|---|---|---|
| No. 3 Strong Wind | 41–62 | 22–33 | 6–7 |
| No. 8 Gale or Storm | 63–117 | 34–63 | 8–11 |
| No. 10 Hurricane | 118 and above | 64 and above | 12 |
Height, and what Beaufort really is
Height is the other condition people miss. The international standard is ten metres above open, level ground. A hilltop or a rooftop reads higher by nature, so those numbers cannot be compared with a signal threshold directly.
Beaufort is not a wind speed at all. It describes the state of the sea — wave height, whitecaps, spray — and the wind speeds attached to each force were fitted afterwards. That is why the same force spans slightly different ranges in different tables.
Storm sizes on the map are drawn from one-minute winds: the ten-minute figures issued by the Japan Meteorological Agency are divided by 0.82 — raising them about 22 per cent — before they enter the map, while figures from the US centres are already one-minute and are left alone. That 0.82 is not the pure averaging-period factor of 0.88 quoted above, which would raise them about 14 per cent. It is a calibration value inverted from Hong Kong station peaks across five cases, and it also absorbs the JMA's systematic under-reading of intense western North Pacific storms. Those converted numbers exist only inside the map. Readings, tables and quoted text keep the wording each agency issued, and the intensity classes used on this site follow the Observatory's ten-minute scale.
Further reading
- Storm surge: why low-lying areas flood before the wind peaks
The flooding is not rain. It is sea water pushed ashore — and its worst moment is not the windiest one.
- How the No. 8 signal chance is computed
Forty perturbed tracks, and a count of how many bring gale-force wind to Hong Kong's offshore stations.
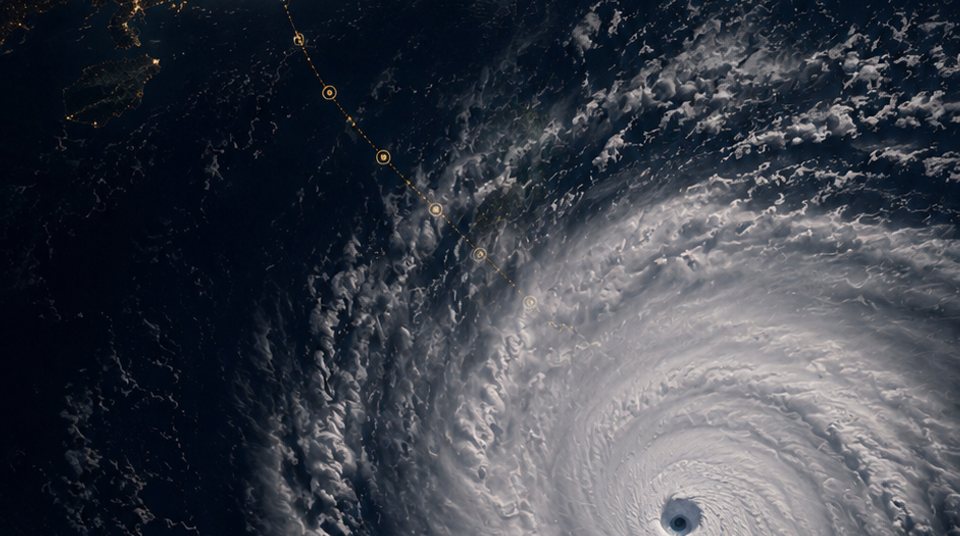
- Wind radii: how big a typhoon really is
The gale radius on a storm page is the agency's figure; its threshold sits below a No. 8, and the circle is not really a circle.
 Storm surge: why low-lying areas flood before the wind peaks
 How the No. 8 signal chance is computed
 Wind radii: how big a typhoon really is