

The percentage on a storm page is Aethopia's own estimate, not an Observatory forecast. It comes from four steps: take the agency track, spread it into forty plausible variants, work out how hard each one blows on Hong Kong, then count the share that reaches the threshold.
It starts from the agency track
This site does not forecast where a storm will go. The input is the forecast track and intensity issued by the Japan Meteorological Agency or the US National Hurricane Center; Aethopia only spreads an uncertainty envelope around it. The track is theirs, the envelope is ours.
Forty tracks
For each advisory the model perturbs the official track forty times: steering, cross-track offset, intensity and initial wind each get a random nudge the size of a normal forecast error, and each variant is integrated hour by hour to the end of the advisory. The seed is fixed, so one advisory always gives one answer.
The forty lines are the faint cone on the map. The cone is the spread itself; no mean track is drawn, because a mean track is a path no member actually took.
How hard each track blows on Hong Kong
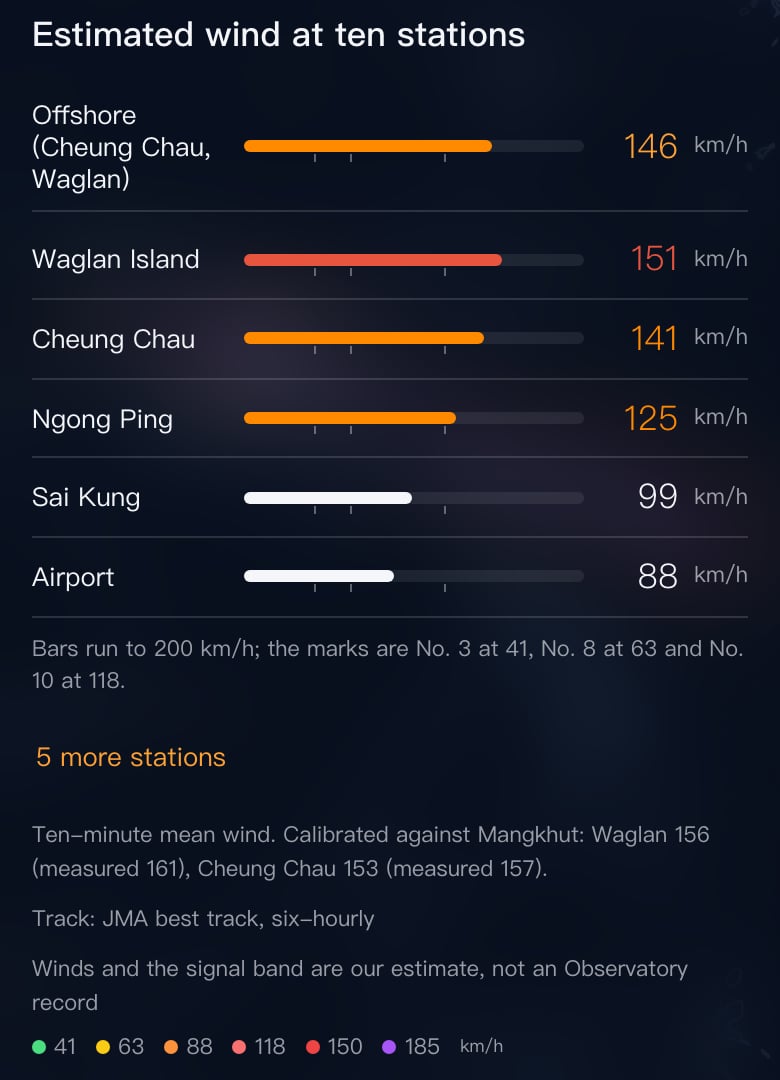
Every track has a wind field for every hour. The model reads it at the Observatory's eight reference anemometer stations plus Waglan Island and Ngong Ping; each station carries an exposure factor inverted from what was measured in Mangkhut in 2018. Weakening after landfall comes from a land mask.
The signal test uses the mean of the two offshore stations, Cheung Chau and Waglan Island, as a ten-minute average, because that is closest to what the Observatory weighs when it issues a signal.
The number is a share
| Band | Ten-minute mean wind | Signal |
|---|---|---|
| Strong | from 41 km/h | No. 3 |
| Gale | from 63 km/h | No. 8 |
| Storm | from 88 km/h | No. 8 or 9 |
| Hurricane | from 118 km/h | No. 10 |
Count the tracks whose offshore peak reaches 63 km/h; that share is the No. 8 chance. Twenty-eight of forty is 70%. The No. 9 and No. 10 figures work the same way with 88 and 118 km/h.
The confidence range and the curve
Forty is a small sample, so every figure carries a Wilson 95% interval. It covers sampling error only: forty misses do not mean zero, they mean the chance is probably below about 9%. It does not cover the uncertainty of the forecast itself.
The model runs once per advisory, every three hours for JMA storms, and the runs joined up are the curve on the page; “+12% from 6 h ago” reads straight off it.
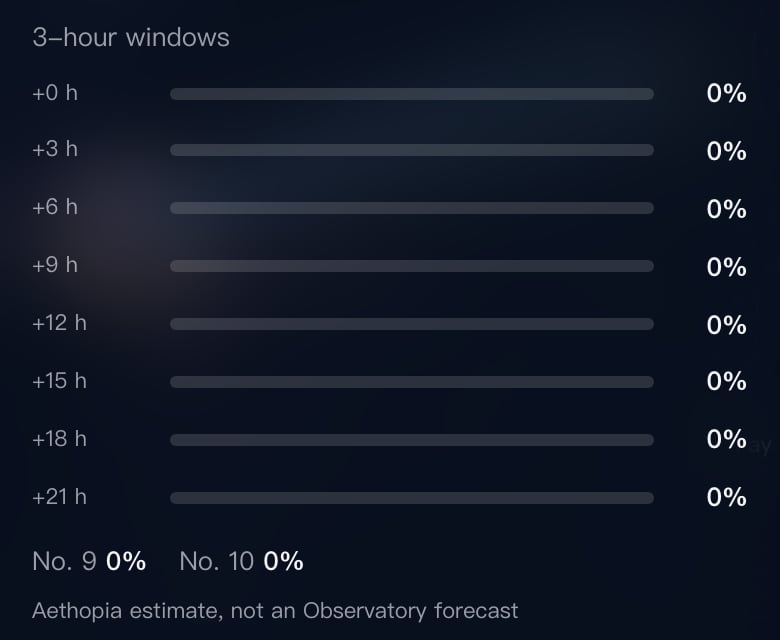
The calibration constants come from station measurements in five past storms: Mangkhut, Hato, Saola, Vicente and Wipha. A storm happening now has nothing to calibrate against, so it is always marked uncalibrated. The figure is research, not an Observatory forecast; for work, school and road closures, the Observatory's signal is the only reference.
